Eleven inventory sections, every live sensor, and the parts nobody else reads.
This page is the full list. Each item below is a field SPECTRA reads on the machine it runs on, not an estimate and not a lookup.
The whole machine, field by field
Collected from WMI, SMBIOS, CPUID, the registry, EDID, the vendor GPU libraries and the kernel driver, then shown as a tree you can fold and export.
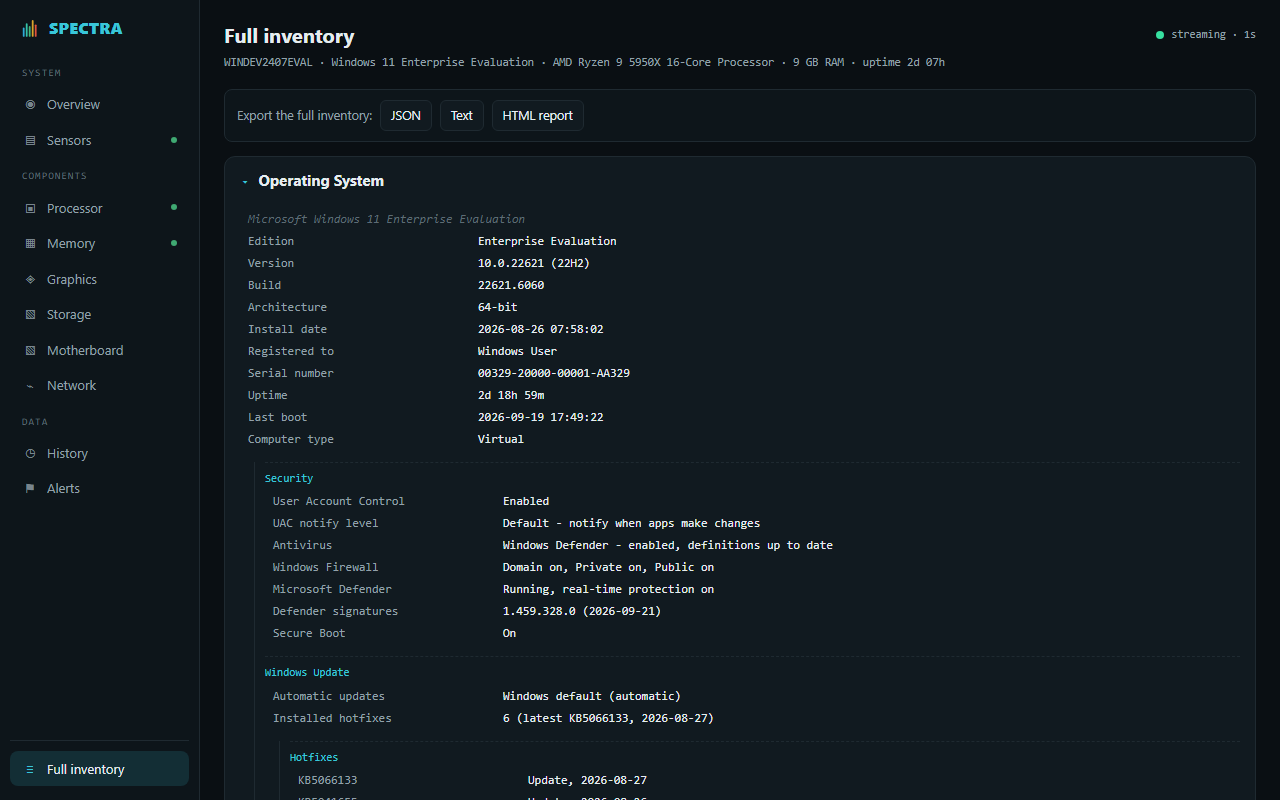
Operating system
Edition, build, install date, activation, hotfixes, security center state, power plan, locale, system folders, scheduled tasks, services, environment, processes, TCP connections.
CPU
Name, code name, revision, socket, family / model / stepping, cores and threads, caches, bus and multiplier, instruction sets, virtualization and hypervisor state, per-core clocks.
RAM
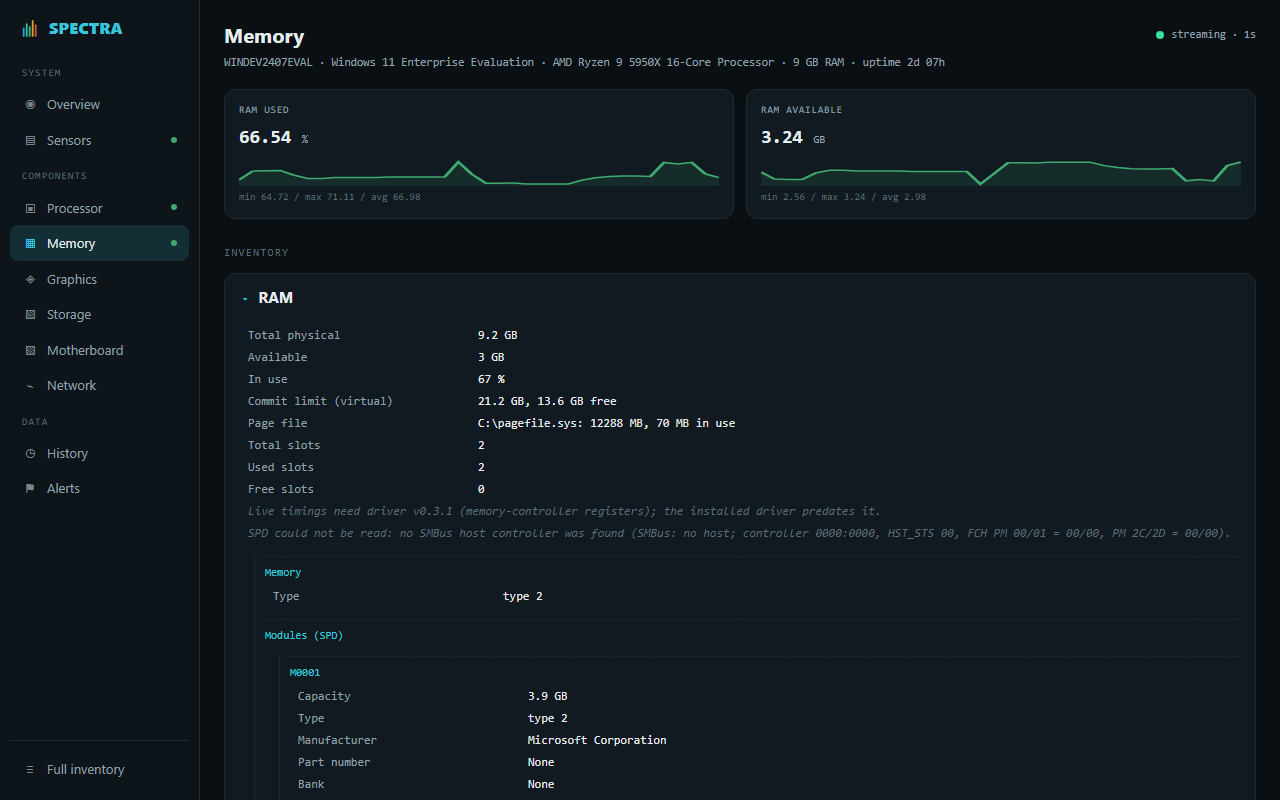
Totals, slots, channels, DRAM clock, each module's SPD: manufacturer, part number, DRAM maker, JEDEC timing table, XMP 2.0 / 3.0 and EXPO profiles, plus the live timings the controller is running.
Motherboard
Maker, model, chipset and southbridge by name, BIOS, expansion slots with lane width and PCIe generation, and the hardware monitor: voltages, temperatures, fans.
Graphics
Monitors from EDID (size, native mode, serial), adapters with true VRAM, driver, PCIe link, VBIOS, architecture and process node on NVIDIA, performance levels.
Storage
Drives, interface, firmware, partitions and volumes, full S.M.A.R.T. attribute tables and NVMe health logs, AMD RAID array members, optical drives.
Audio and peripherals
Playback and capture endpoints with their formats, keyboards, mice, printers with duplex / colour / paper, USB and other devices with their drivers.
Network
Adapters with addresses, DNS, DHCP and link speed, proxy state for WinInet and WinHTTP, discovery per firewall profile, shares, live throughput.
Every second, with history
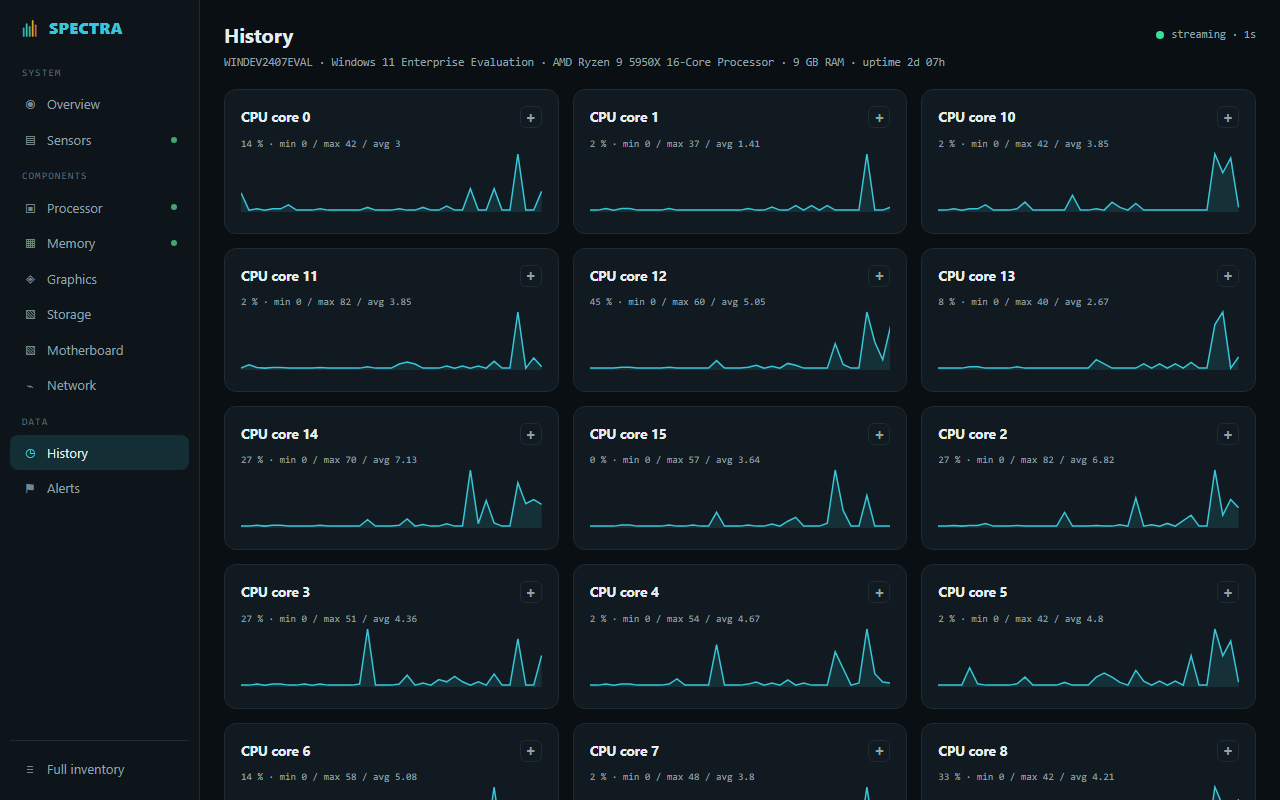
A service running as SYSTEM samples the sensors and hands them to the window, so nothing needs an admin prompt and the readings keep coming while the window is closed to the tray.
Ring 0, on a short leash
Some readings only exist below Windows. SPECTRA's driver reaches them through a fixed allow-list of ports and registers, nothing more; it is signed by Microsoft's hardware program, so it loads on any Windows 10 or 11 machine with Secure Boot on.
Nuvoton NCT67xx and ITE IT87xx chips: voltage rails, temperatures, fan speeds, decoded with the board maker's wiring.
DDR4 and DDR5 module EEPROMs on Intel and AMD chipsets, checksum-verified, with XMP 2.0, XMP 3.0 and EXPO profiles.
CL, tRCD, tRP, tRAS, tRC, tRFC, tREFI, tFAW, tRRD, tWR, tCWL, command rate, gear-down and power-down, read from the AMD memory controller.
Limits, not dashboards to stare at
Nine rules preconfigured: CPU, GPU and hotspot temperatures, VRAM, disk temperature, CPU load, memory. Add one from any sensor with a click. A tray notification when a limit is crossed, a quiet period so nothing spams you, and a log of every event.
Take the data with you
JSON, plain text or a self-contained HTML report from the app. The spectra command exports, monitors, diffs two snapshots and serves the dashboard from any prompt. A local JSON API for your own tools.
Quiet, signed, honest
Updates download in the background, are checked against a SHA-256 and the publisher's signature, and install only while you are away from the machine. Telemetry is anonymous hardware facts, off by default, previewable, never the inventory.