Know exactly what is inside your PC, and what it is doing right now.
SPECTRA reads every component down to the memory module's SPD and the board's voltage rails, watches temperatures, fans, clocks and drive health every second, and tells you the moment something crosses a limit you set.
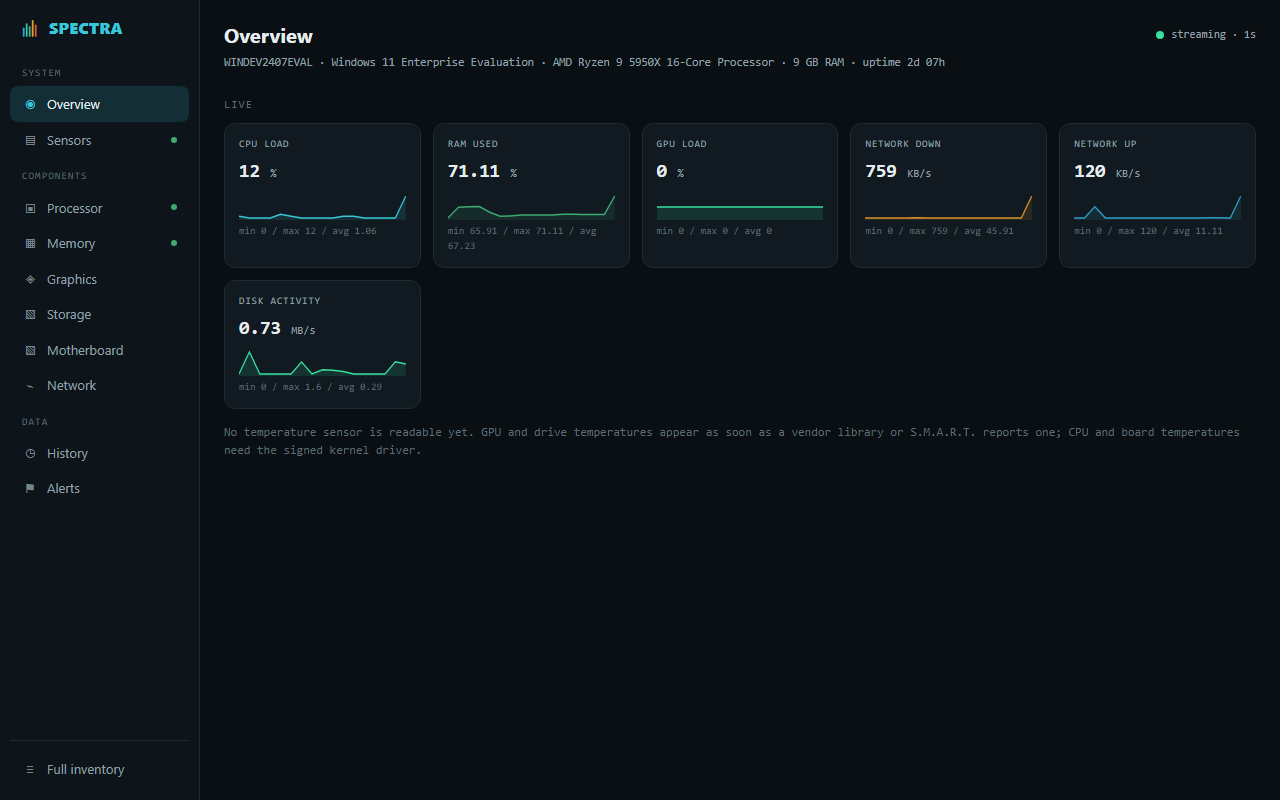
One window for the whole machine
Complete inventory
Operating system, CPU, RAM, motherboard, graphics, storage, optical, audio, peripherals and network, each field by field: CPUID, SMBIOS, EDID monitors, true VRAM, hotfixes, drivers, partitions.
Live sensors, every second
Temperatures, loads, clocks, fans, power and throughput with min / max / average and a rolling history for each, from CPU, GPU (NVIDIA, AMD, Intel), drives, network and the board itself.
Signed kernel driver
Board voltages, fan speeds and board temperatures from the Super-I/O chip, memory module SPD with XMP and EXPO profiles, and the live DDR4 / DDR5 timings from the memory controller. Attested by Microsoft, allow-listed by design.
Drive health that means something
Real S.M.A.R.T. for NVMe and SATA, read without an admin prompt: wear, temperature, attribute state and one health number per drive. Members of AMD RAID arrays included.
Alerts you define in one click
Nine sensible rules out of the box. A plus sign next to any sensor adds another. When a limit is crossed you get a tray notification, and the Alerts page keeps the record.
Exports, a CLI and an API
Save the full inventory as JSON, text or a self-contained HTML report. The spectra command does the same from any prompt, and a local JSON API streams the sensors to anything you build.
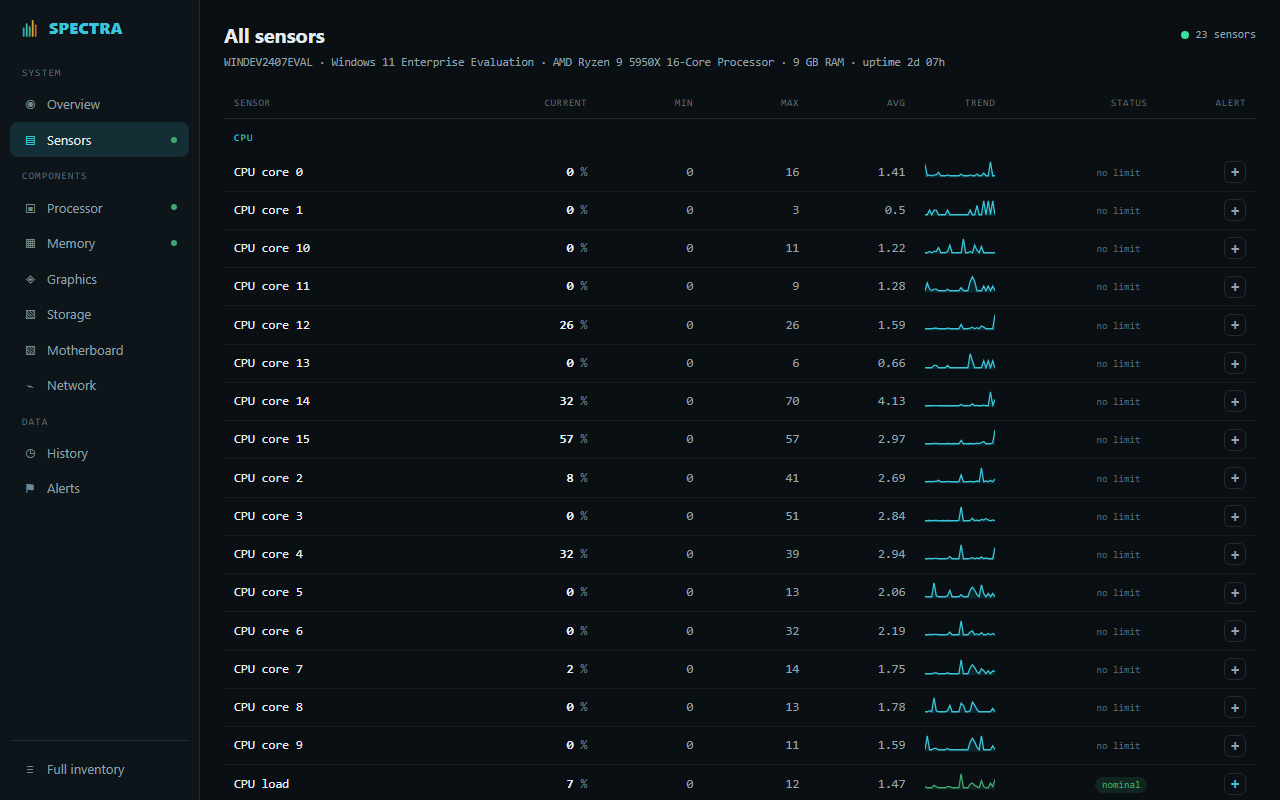
All sensors. Every reading the machine exposes, grouped, with its trend and a plus sign to put a limit on it.
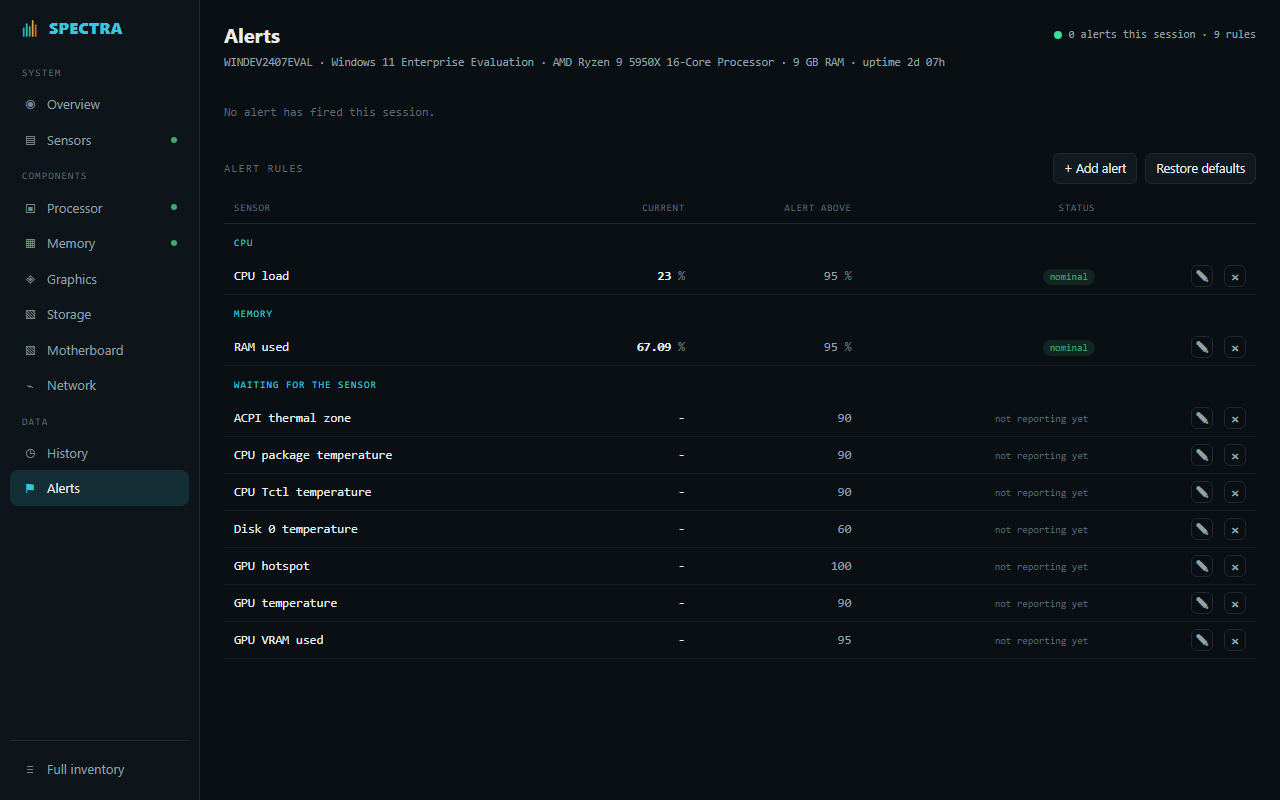
Alert rules. Edit, remove or restore them right where they fire. Nothing to dig for in a settings dialog.
Free for personal use. Pro for the rest.
The full inventory and the live monitor cost nothing. Pro covers commercial use and adds [PRO FEATURES]. One purchase, every update included.